prometheus + grafana 踩坑记
一些参考地址
https://blog.richliu.com/2019/02/13/3630/grafana-prometheus-python-client
https://yunlzheng.gitbook.io/prometheus-book/part-ii-prometheus-jin-jie/grafana/templating#shi-yong-bian-liang-dong-tai-chuang-jian-panel-he-row //比较全面的配置
https://www.ibm.com/developerworks/cn/cloud/library/cl-lo-prometheus-getting-started-and-practice/index.html
https://www.zhukun.net/archives/8281
部署详解:
https://www.aneasystone.com/archives/2018/11/prometheus-in-action.html
https://www.hi-linux.com/posts/25047.html
https://songjiayang.gitbooks.io/prometheus/content/ha/prometheus.html //高可用 和 热加载
http://chenzhijun.me/2018/05/02/nginx-proxy-promethues-grafana/ 反向代理prometheus 和 grafana
prometheus的架构
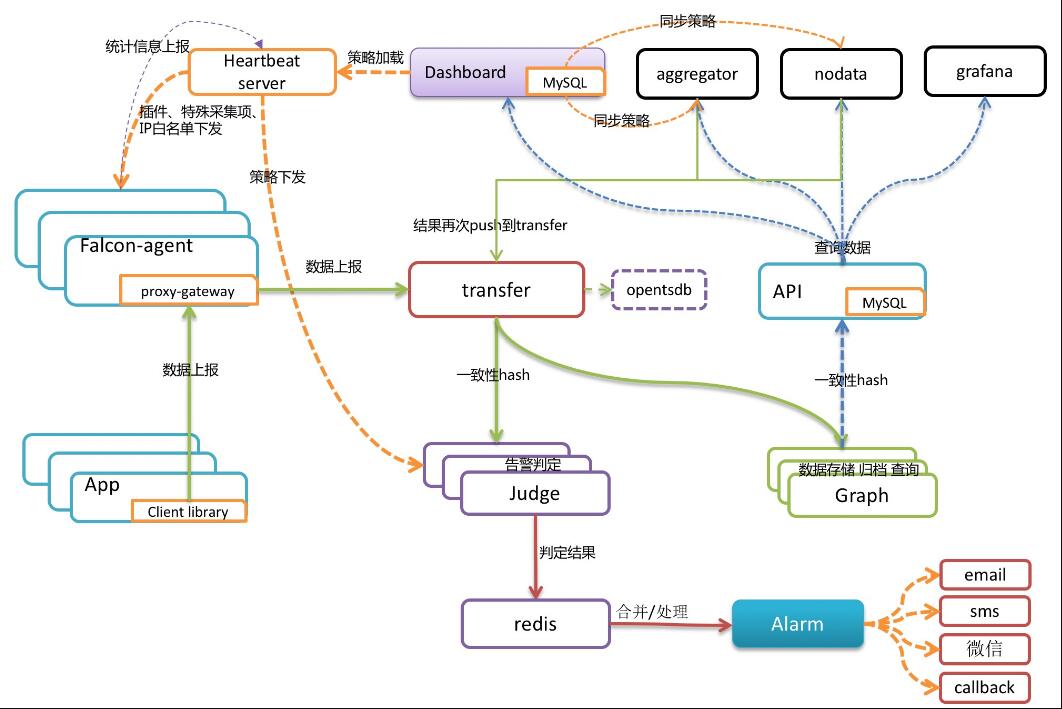
官方的架构图: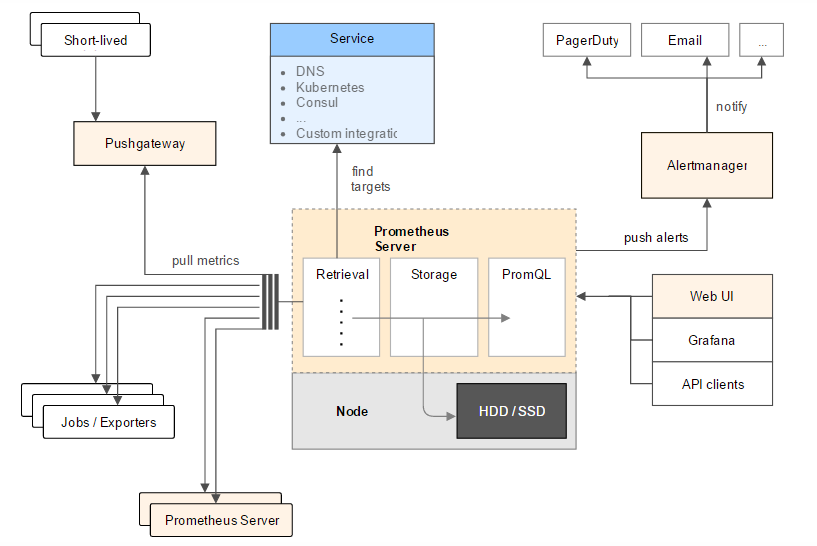
Retrieval:中定义了Prometheus Server需要从哪些地方拉取数据Jobs / Exporters:Prometheus可以从Jobs或Exporters中拉取监控数据。Exporter以Web API的形式对外暴露数据采集接口。Prometheus Server:Prometheus还可以从其他的Prometheus Server中拉取数据Pushgateway:对于一些以临时性Job运行的组件,Prometheus可能还没有来得及从中pull监控数据的情况下,这些Job已经结束了,Job运行时可以在运行时将监控数据推送到Pushgateway中,Prometheus从Pushgateway中拉取数据,防止监控数据丢失Service:是指Prometheus可以动态的发现一些服务,拉取数据进行监控,如从DNS,Kubernetes,Consul中发现Storage:即Prometheus的存储,利用Prometheus Server的本地存储PromQL:是Prometheus的查询语句,利用PromQL可以和一些WEBUI(如Grafana)集成AlertManager:是一个独立于Prometheus的外部组件,用于监控系统的告警,通过配置文件可以配置一些告警规则,Prometheus会把告警推送到AlertManager。
1.搭建prometheus 服务端
1.1 获取最新的二进制包
1 | wget https://github.com/prometheus/prometheus/releases/download/v2.10.0/prometheus-2.10.0.linux-amd64.tar.gz |
1.2 解压检测版本
1 | tar xf prometheus-2.10.0.linux-amd64.tar.gz -C ./prometheus --strip-components 1 |