prometheus + grafana 踩坑记
一些参考地址
https://blog.richliu.com/2019/02/13/3630/grafana-prometheus-python-client
https://yunlzheng.gitbook.io/prometheus-book/part-ii-prometheus-jin-jie/grafana/templating#shi-yong-bian-liang-dong-tai-chuang-jian-panel-he-row //比较全面的配置
https://www.ibm.com/developerworks/cn/cloud/library/cl-lo-prometheus-getting-started-and-practice/index.html
https://www.zhukun.net/archives/8281
部署详解:
https://www.aneasystone.com/archives/2018/11/prometheus-in-action.html
https://www.hi-linux.com/posts/25047.html
https://songjiayang.gitbooks.io/prometheus/content/ha/prometheus.html //高可用 和 热加载
http://chenzhijun.me/2018/05/02/nginx-proxy-promethues-grafana/ 反向代理prometheus 和 grafana
prometheus的架构
官方的架构图: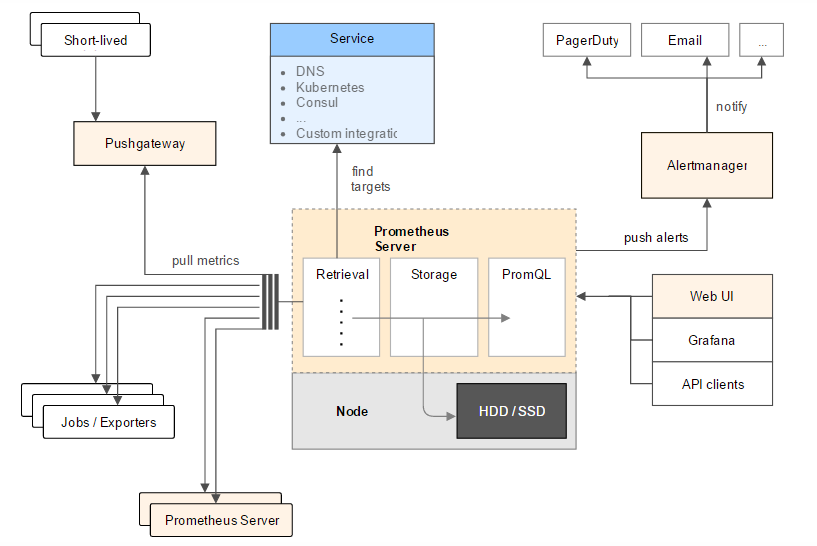
Retrieval:中定义了Prometheus Server需要从哪些地方拉取数据Jobs / Exporters:Prometheus可以从Jobs或Exporters中拉取监控数据。Exporter以Web API的形式对外暴露数据采集接口。Prometheus Server:Prometheus还可以从其他的Prometheus Server中拉取数据Pushgateway:对于一些以临时性Job运行的组件,Prometheus可能还没有来得及从中pull监控数据的情况下,这些Job已经结束了,Job运行时可以在运行时将监控数据推送到Pushgateway中,Prometheus从Pushgateway中拉取数据,防止监控数据丢失Service:是指Prometheus可以动态的发现一些服务,拉取数据进行监控,如从DNS,Kubernetes,Consul中发现Storage:即Prometheus的存储,利用Prometheus Server的本地存储PromQL:是Prometheus的查询语句,利用PromQL可以和一些WEBUI(如Grafana)集成AlertManager:是一个独立于Prometheus的外部组件,用于监控系统的告警,通过配置文件可以配置一些告警规则,Prometheus会把告警推送到AlertManager。
1.搭建prometheus 服务端
1.1 获取最新的二进制包
1 | wget https://github.com/prometheus/prometheus/releases/download/v2.10.0/prometheus-2.10.0.linux-amd64.tar.gz |
1.2 解压检测版本
1 | tar xf prometheus-2.10.0.linux-amd64.tar.gz -C ./prometheus --strip-components 1 |
1.3 配置systemctl形式启动服务:
1 | # cat /etc/systemd/system/prometheus.service |
1.4 访问9090web端口
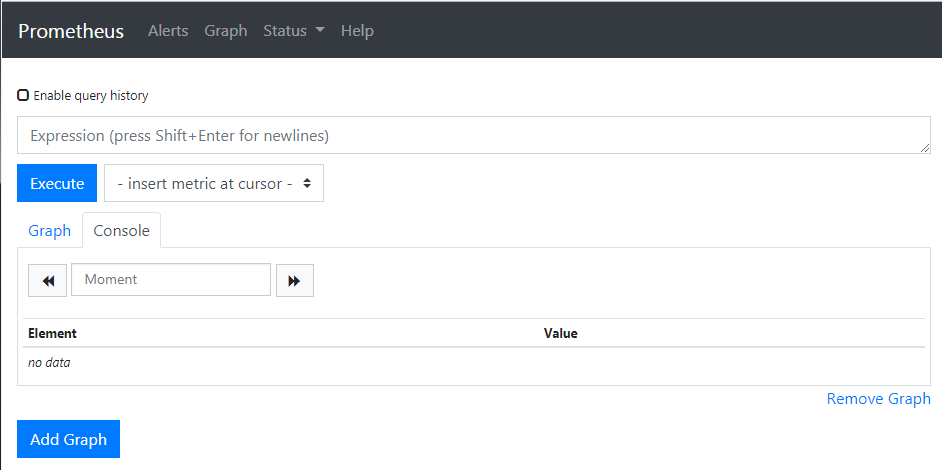
http://192.168.36.17:9090/metrics //这个接口可以看到所有监控到的metric
2.为了测试监控,使用node_exporter进行cpu 网络等基础监控
2.1 获取node_exporter二进制包
1 | wget https://github.com/prometheus/node_exporter/releases/download/v0.18.1/node_exporter-0.18.1.linux-amd64.tar.gz |
2.2 解压检测版本
1 | tar xf node_exporter-0.18.1.linux-amd64.tar.gz -C ./node_exporter --strip-components 1 |
2.3 配置systemctl形式启动服务:
1 | cat /etc/systemd/system/node_exporter.service |
2.4 获取所有的node_exporter 监控metrics
http://192.168.36.17:9100/metrics //所有的监控指标(metrics)都能在这里获取
2.5 将node_exporter监控指标加入到prometheus中
修改配置文件,新增job linux,配置一个labels {instance='localhost'}1
2
3
4
5
6
7
8
9
10
11
12
13
14
15
16
17cat /usr/local/src/prometheus/prometheus.yml | egrep -v "#|^$"
global:
alerting:
alertmanagers:
- static_configs:
- targets:
rule_files:
scrape_configs:
- job_name: 'prometheus'
static_configs:
- targets: ['localhost:9090']
# 添加的部分
- job_name: 'linux'
static_cinfigs:
- targets: ['localhost:9100']
labels:
instance: localhost
2.6 两种方式热加载 prometheus 服务端
1 | --> kill-HUP \`pidof prometheus\` |
2.7 检测endpoint(job_name里面指定的target)是否正常
http://192.168.36.17:9090/targets 正常情况下是up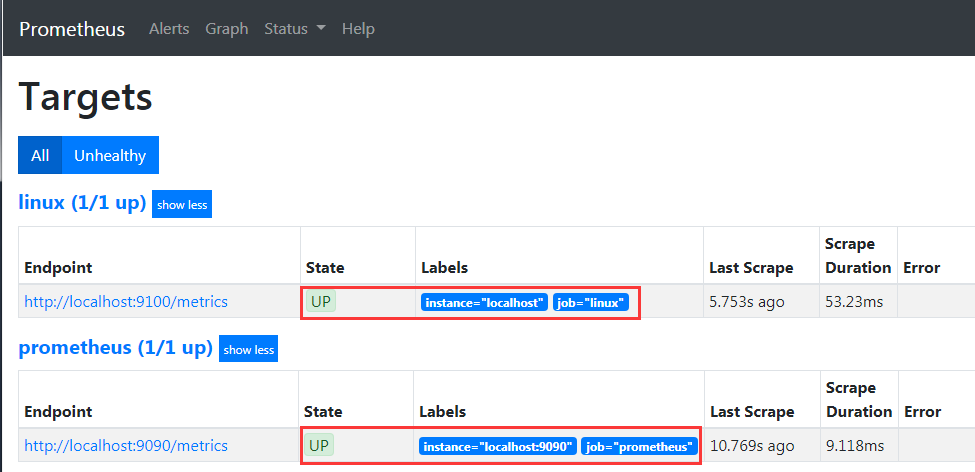
3.整合prometheus 和 grafana
https://grafana.com/dashboards //这里有需要的模板
3.1直接安装grafana就行了,默认端口3000 admin/admin
1 | wget https://dl.grafana.com/oss/release/grafana-6.2.5-1.x86_64.rpm |
3.2 登录grafana配置数据源:
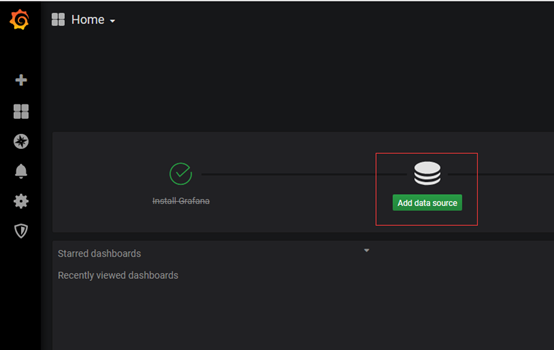
选择数据类型为prometheus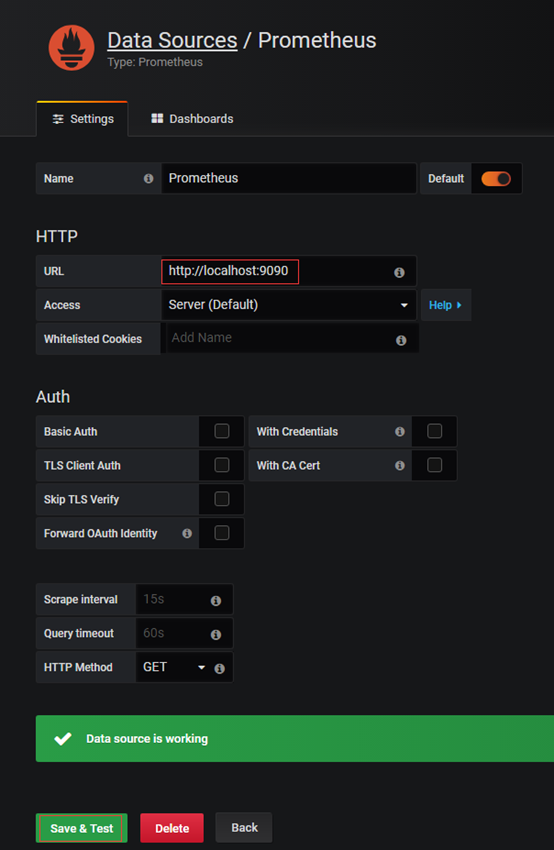
测试通过保存即可。
3.3配置环境变量
首先来理解一下几个模板里用到的变量
从配置那里就可以看到variables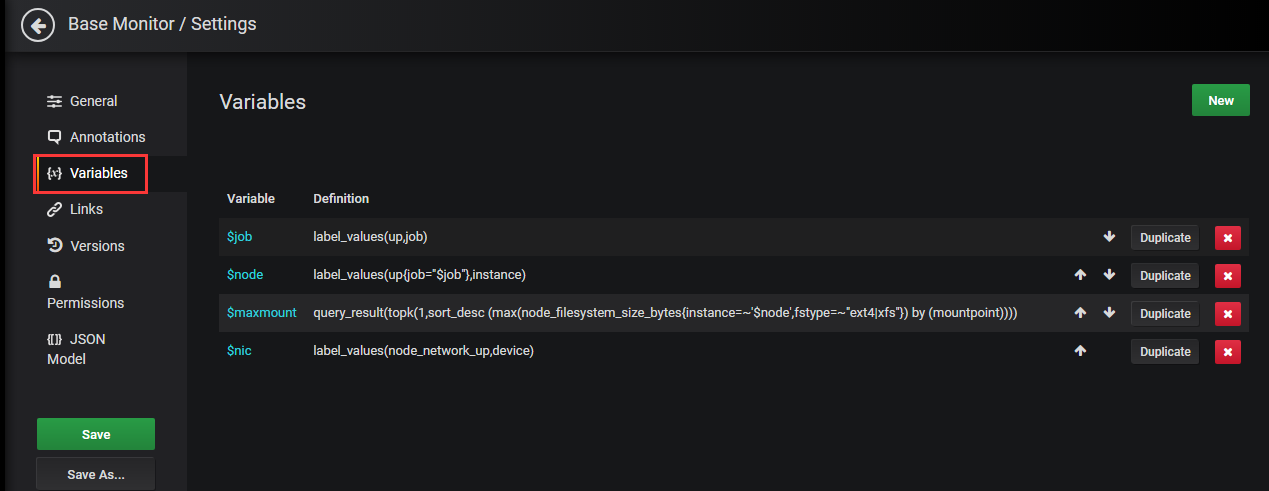
3.3.1获取分组变量
label_values(label) 返回Promthues所有监控指标中,标签名为label的所有可选值label_values(metric, label) 返回Promthues所有监控指标metric中,标签名为label的所有可选值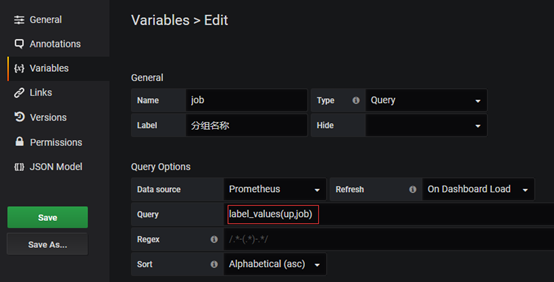
label_values是grafana语法。 这里label_values(up,job) 是获取所有的job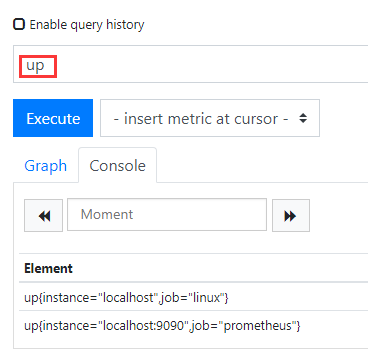
也就是这里为up的所有返回值
3.3.2获取ip
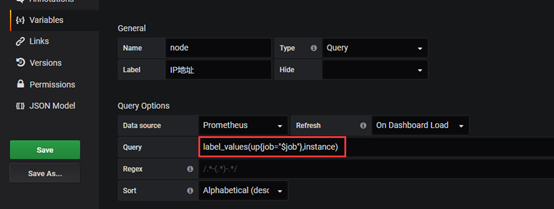
label_values(up{job="$job"},instance)
这里就是根据上边的一个$job(即是linux),然后获取instance的值(就是prometheus指定的instance标签的值,这里是ip = localhost)。 实际上返回的是多个值,所以后面网卡的时候需要过滤一下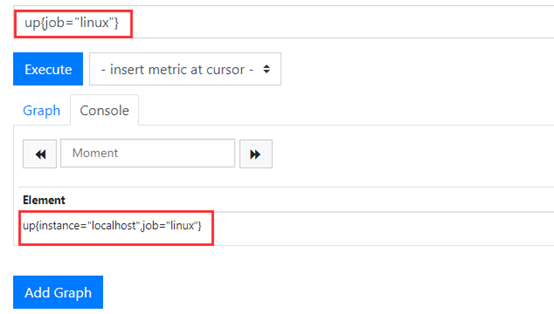
对应的就是prometheus后台的这个值label_values(up{job="$job"},instance) 应该返回的是localhost,因为这里只有一条记录(加了标签限制)
3.3.3获取监控网卡名称
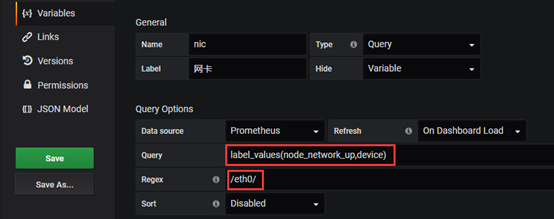
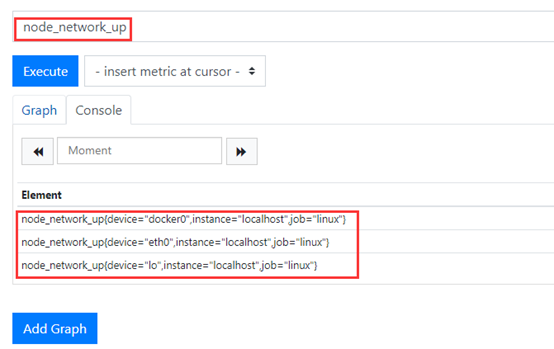
网卡这里的返回结果就有3条,我们需要过滤一下(eth0) Regex 匹配,符合js regex 规则
3.4 配置监控图
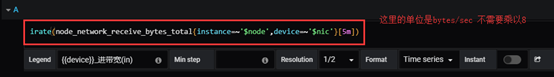
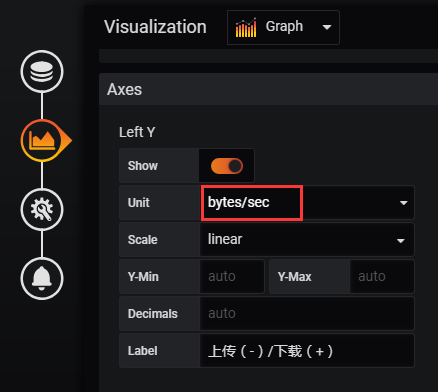
3.4.1 网卡流量进口监控 这里用bytes做单位
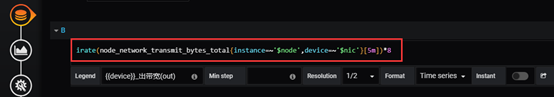
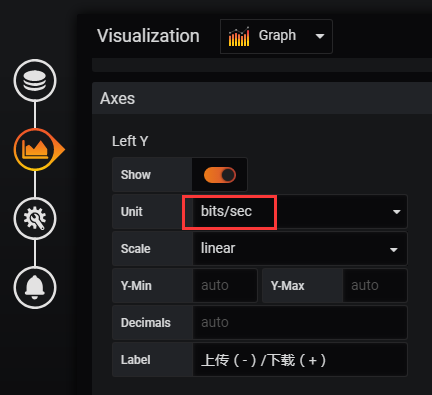
3.4.2 网卡流量出口监控 这里用bit作单位
3.5 监控结果
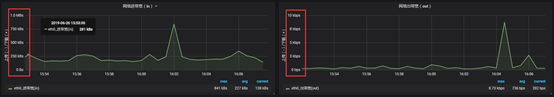
最后的出图也要注意,bit(出口带宽)看的时候的数值也要除以8才是正常的流量值,所以图像上看到的数值会偏大(1B=8bit)
附录
node exporter的一些计算语句1
2
3
4
5
6
7
8
9
10
11
12
13
14
15
16
17
18
19
20
21
22
23
24
25
26
27
28
29
30
31
32
33
34
35
36
37
38CPU使用率(单位为percent)
100 - (avg by (instance) (irate(node_cpu_seconds_total{mode="idle"}[5m])) * 100)
内存已使用(单位为bytes)
node_memory_MemTotal_bytes-node_memory_MemFree_bytes-node_memory_Cached_bytes - node_memory_Buffers_bytes - node_memory_Slab_bytes
内存使用量(单位为bytes/sec)
node_memory_MemTotal_bytes-node_memory_MemFree_bytes- node_memory_Cached_bytes - node_memory_Buffers_bytes - node_memory_Slab_bytes
内存使用率(单位为percent)
((node_memory_MemTotal_bytes-node_memory_MemFree_bytes- node_memory_Cached_bytes-node_memory_Buffers_bytes-node_memory_Slab_bytes)/node_memory_MemTotal_bytes) * 100
server1的内存使用率(单位为percent)
((node_memory_MemTotal_bytes{instance="server1"}-node_memory_MemAvailable_bytes{instance="server1"})/node_memory_MemTotal_bytes{instance="server1"}) * 100
server2的磁盘使用率(单位为percent)
((node_filesystem_size_bytes{fstype=~"xfs|ext4",instance="server2"}-node_filesystem_free_bytes{fstype=~"xfs|ext4",instance="server2"})/node_filesystem_size_bytes{fstype=~"xfs|ext4",instance="server2"}) * 100
uptime时间(单位为seconds)
time() - node_boot_time
server1的uptime时间(单位为seconds)
time() - node_boot_time_seconds{instance="server1"}
网络流出量(单位为bytes/sec)
irate(node_network_transmit_bytes_total{device!~"lo|bond[0-9]|cbr[0-9]|veth.*"}[5m]) > 0
server1的网络流出量(单位为bytes/sec)
irate(node_network_transmit_bytes_total{instance="server1",device!~"lo|bond[0-9]|cbr[0-9]|veth.*"}[5m]) > 0
网络流入量(单位为bytes/sec)
irate(node_network_receive_bytes_total{device!~"lo|bond[0-9]|cbr[0-9]|veth.*"}[5m]) > 0
server1的网络流入量(单位为bytes/sec)
irate(node_network_receive_bytes_total{instance="server1",device!~"lo|bond[0-9]|cbr[0-9]|veth.*"}[5m]) > 0
磁盘读取速度(单位为bytes/sec)
irate(node_disk_read_bytes_total{device=~"sd.*"}[5m])
我的指标如何计算?
Grafana提供了许多已经设定好的dashboards可供使用(例如这个https://grafana.com/dashboards/704), 使用起来很简单, 在https://grafana.com/dashboards/704页面上”Download JSON”, 然后回到自己的Grafana页面上, 选择左侧的”Create”-“Import”即可导入别人建立好的Dashboard. 然后可以研究一下别人的指标是如何计算的.